How often have you felt lost in linear algebra underlying many advanced machine learning methods? Concepts like matrix, vectors, covariance, and eigenvalues can seem disconnected from practical data science.
However, intuitively understanding these key ideas can greatly level up your modeling skills and analytical thinking. When dealing with multidimensional data, getting a handle on how variables relate to one another is critical.
Covariance provides that key measure of the linkage between random variables. While it may seem abstract initially, covariance has very real implications.
Some of them include detecting which stock prices move in lockstep, predicting economic recessions, and boosting investment strategies. Eigenvalues of the covariance matrix in turn allow deriving the main axes of variation in a dataset.
After reading this guide, you’ll understand covariance, covariance matrix, it’s formula, eigenvalues, and how they’re interconnected.
Table of Contents
What is Covariance?
Covariance is a statistical measure that quantifies the directional relationship between two random variables. More specifically, covariance looks at how much two variables vary together from their means.
It indicates if greater values of one variable tend to be associated with greater values of the other variable (positive covariance) or lesser values of the other variable (negative covariance).
For two continuous variables X and Y with means μX and μY, the population covariance formula is:
Cov(X,Y) = E[(X – μX)·(Y – μY)]
Where E[ ] represents the expected value.
So in intuitive terms, covariance captures if higher or lower values of X compared to the mean of X tend to go together with higher or lower values of Y compared to its mean. Thus, the sign of the covariance shows the directional tendency, while the magnitude indicates the strength.
In addition, some key properties to note include that it is only defined for random variables, is sensitive to scaling, assumes a linear relationship, and makes no unit adjustment.
Overall, understanding what covariance entails provides a solid foundation for many statistical techniques like regression, PCA, and multivariate modeling.
Calculating Covariance: Covariance Formula
For you to understand covariance, you must first understand variance. Variance describes how the values in a variable vary. It is dependent on how distant the values are from each other.
On the other hand, covariance is a statistical measure that explains the relationship between two random variables. It shows whether the variables are likely to increase or decrease together.
Hence, the formula for the covariance of two variables X and Y is as follows:
Cov(X, Y) = Σ[(Xi — μX) * (Yi — μY)] / (n — 1)
Where:
Xi and Yi are data points of X and Y variables.
μX and μY are the means of X and Y variables.
n is the number of data points.
If Cov(X, Y) is positive, it shows a positive relationship. But if it is negative, it indicates a negative relationship. Moreover, if it’s close to zero, it suggests a weak or no relationship.
What is the Covariance Matrix?
A covariance matrix indicates the covariance values of all pairs of variables in multivariate data. These values illustrate the direction of multivariate data and distribution magnitude in a multidimensional space.
It can also enable you to collect information concerning how data spreads between two dimensions. Furthermore, you can only calculate the covariance between two variables. The covariance between the same variables is equivalent to the variance.
Again, the diagonal illustrates the variance of each variable. Additionally, a symmetric matrix portrays the covariance of each pair of variables. In the covariance matrix, these values represent the direction of multivariate data and distribution magnitude in a multidimensional space.
Thus, you can collect information on how data spreads between two dimensions by controlling these values.
Covariance Matrix Formula
A covariance matrix encompasses the covariances between multiple variables in one matrix structure. Given a dataset with p variables, the covariance matrix is a p x p symmetric matrix where each element (i,j) is the covariance between variable i and variable j.
So, for a random vector X with variables X1, X2, …. Xp, the population covariance matrix Σ is calculated as:
Σ = E[(X – μ)(X – μ)T] …… Covariance matrix formula
Where:
μ is the mean vector of X
(X – μ) centers each variable around its mean
(X – μ)T is the transpose of the centered matrix
E[ ] takes the expected value of the outer product
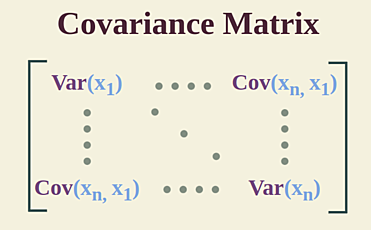
This expands out to:
Var(X1) Cov(X1,X2)… Cov(X1,Xp)
Σ = Cov(X2,X1) Var(X2)… Cov(X2,Xp)
Cov(Xp,X1) Cov(Xp,X2)… Var(Xp)
Which contains variances on the diagonal and covariances as off-diagonal elements.
Also Read: Grouping Data With R: Step-by-step Guide
Eigenvalues And Eigenvectors of Covariance Matrix
Eigenvalues and eigenvectors are vital components of the covariance matrix. Further, eigenvalues and eigenvectors are used by the methods that require a covariance matrix to obtain the direction and magnitude of the data points.
For instance, the eigenvalues depict the magnitude of the spread in the direction of the principal components in PCA (principal component analysis). But how do you get eigenvalues and eigenvectors from the covariance matrix?
You can get eigenvalues and eigenvectors using NumPy in Python. But first, use the numpy.cov() method to find the covariance matrix. Afterward, you can use the numpy.linalg.eig(M) method to find eigenvalues and eigenvectors.
- The largest eigenvalue corresponds to the first principal component, which is the direction of maximum variance in the data. Its eigenvector defines this axis.
- The second largest eigenvalue corresponds to the second principal component. This is the direction of the remaining maximum variance orthogonal to the first component. And so on.
- Sum of all eigenvalues = total variance in the data.
So in essence, the eigendecomposition of the covariance matrix identifies the axes explaining variance, enabling techniques like PCA. The eigenvectors define a new rotated coordinate system, while eigenvalues quantify the variance along those eigenvector axes.
Bottom Line
Understanding key concepts in linear algebra like covariance, covariance matrices, eigenvalues, and eigenvectors is essential for mastering statistical analysis and machine learning approaches on multivariate data.
Meanwhile, this guide covered the covariance matrix formula, how covariance quantifies the linkage between random variables, encompassing the direction and strength of the relationship. Extending this to the covariance matrix provides a means to simultaneously capture variances and covariances between multiple variables.
Finally, we connected these concepts to eigenvalues and eigenvectors. This enables extracting major axes of variance through principal component analysis.
So, you can now calculate the covariance between variables, construct covariance matrices, and grasp how techniques like PCA leverage eigenvalues and eigenvectors.